The 3D EEG Spectrum Waterfall in NeuroSync Pro Audio+Light shows how measured EEG power is distributed across frequency and time. While the circle view gives a quick summary of calm, focus, stress, artifacts and signal quality, the spectrum graph shows more detail: which frequency areas are relatively strong, where peaks appear, how stable those peaks remain and how closely dominant activity aligns with the offered entrainment frequency.
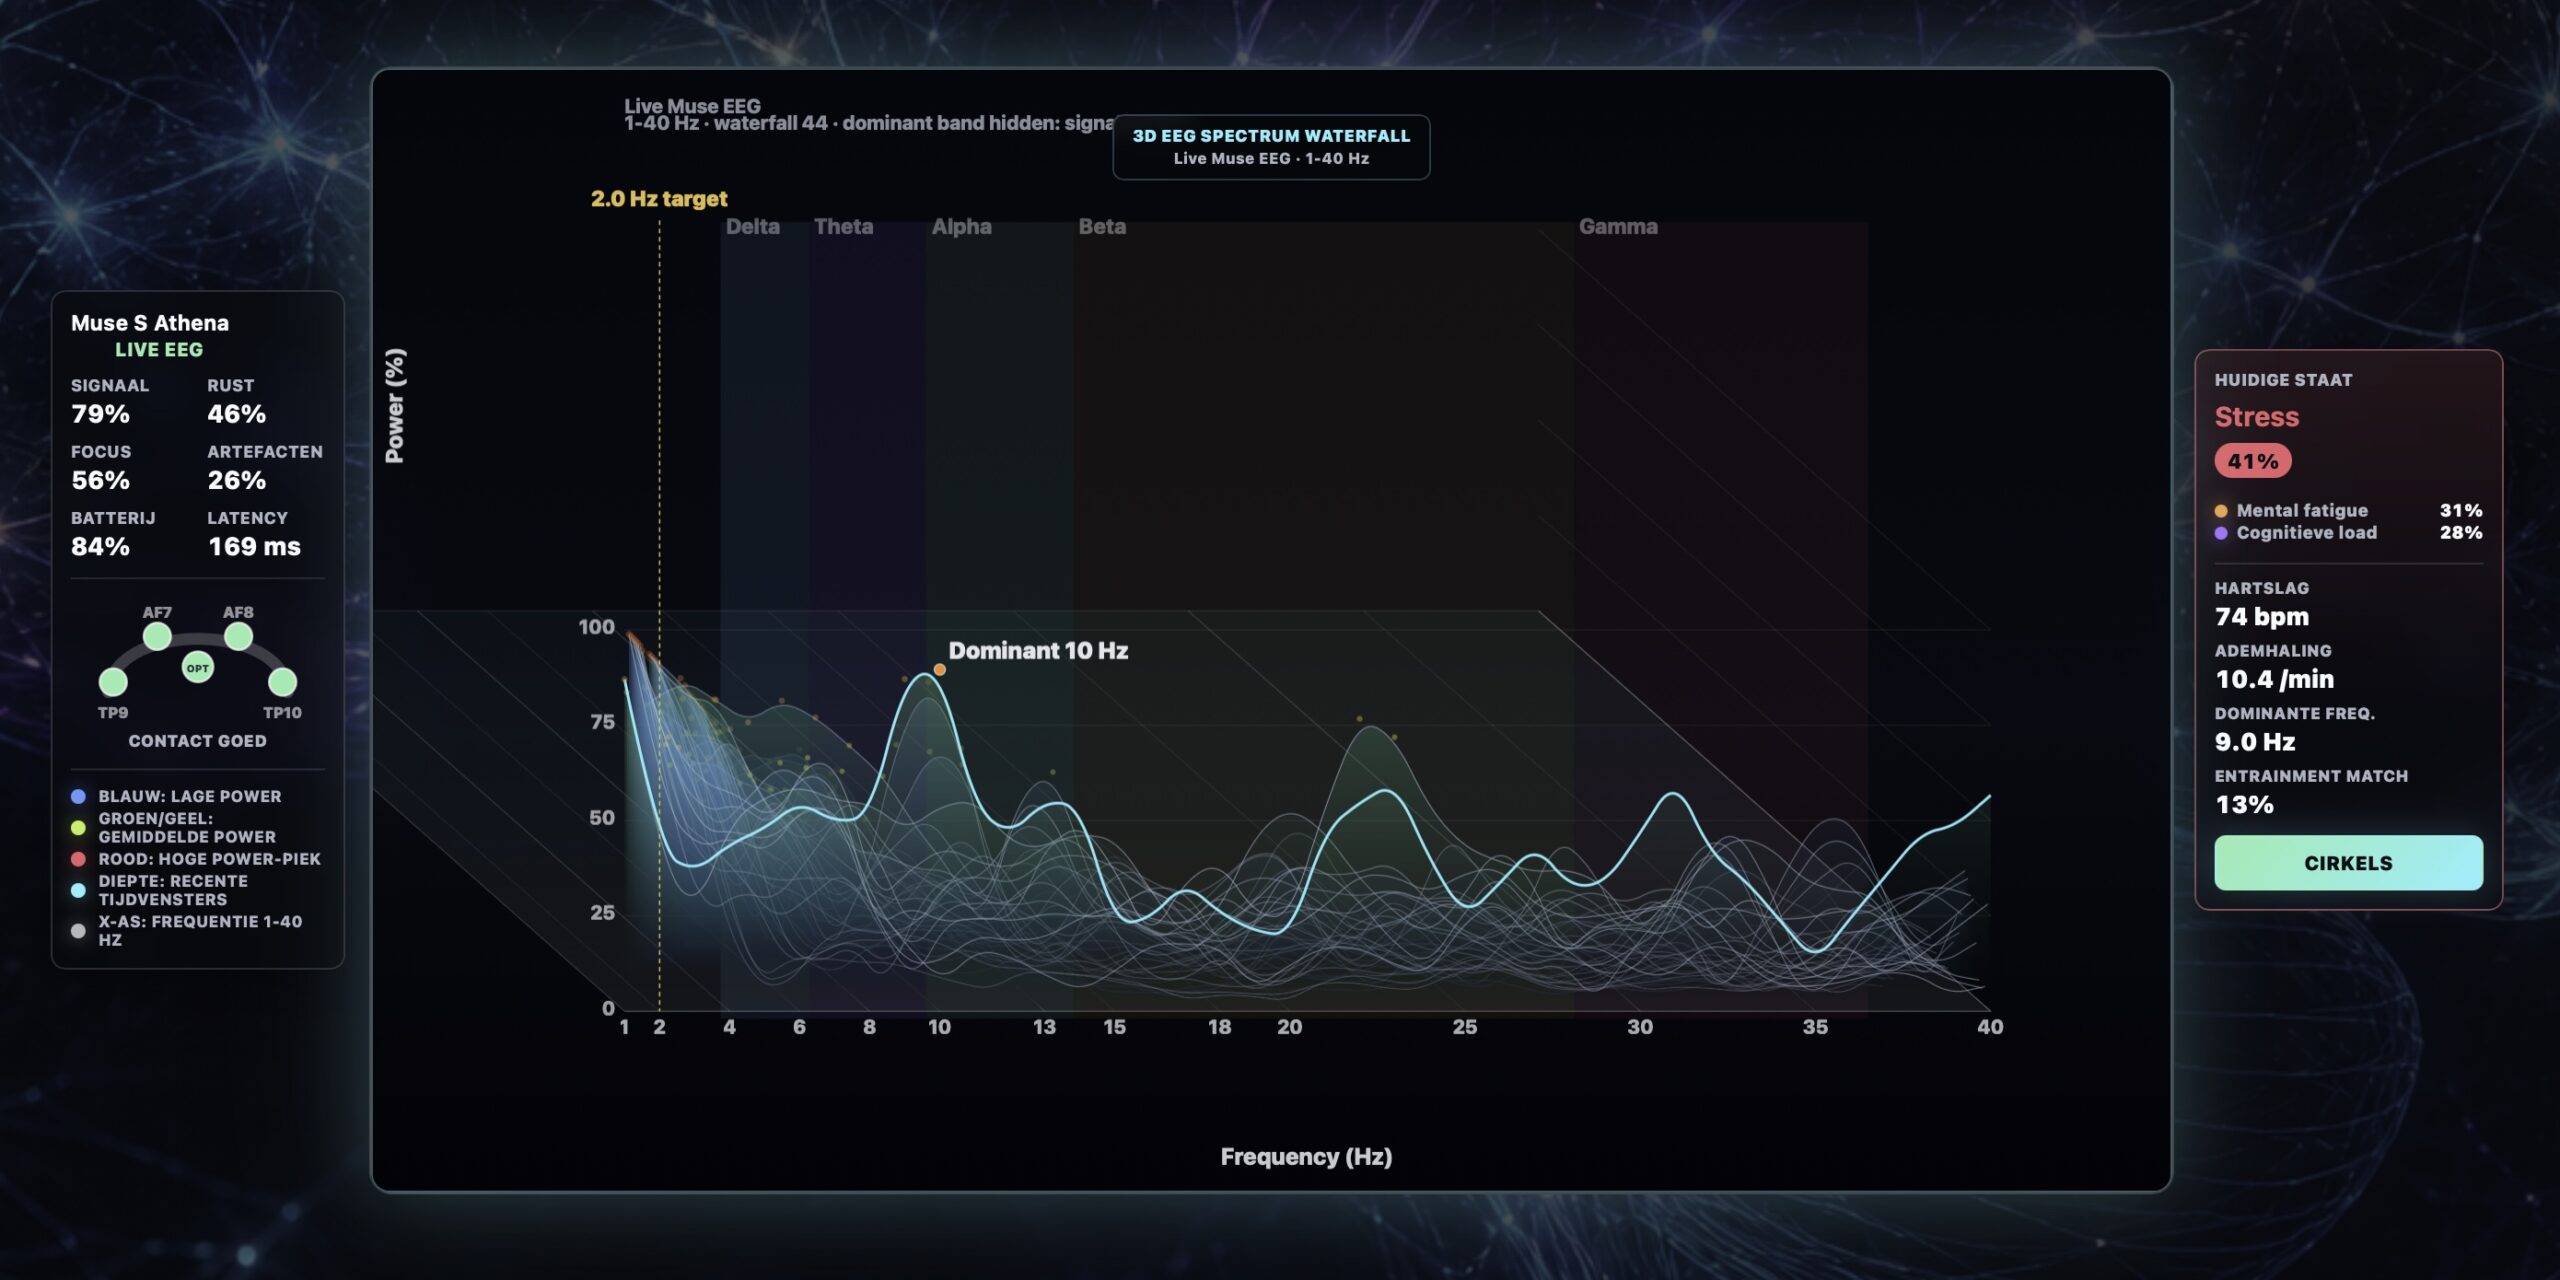
This view is powerful, but it requires nuance. A higher peak does not automatically mean a better response. A dominant frequency does not mean the whole brain runs at one frequency. A low entrainment match does not automatically mean the session failed. The graph is mainly for recognizing patterns, not for turning single moments into hard conclusions.
1. What does the 3D spectrum graph show?
| Element | Meaning | How to read it |
|---|---|---|
| X-axis: frequency | Frequencies from roughly 1 to 40 Hz. | Delta/theta on the left, alpha/beta in the middle, higher beta/gamma on the right. |
| Y-axis: power | Relative strength of the signal per frequency. | Higher values indicate more energy in that frequency area. |
| Depth/lines | Recent time windows in the measurement. | A stable peak appears across multiple lines; a single peak may be noise or movement. |
| Target line | The selected audio/light frequency. | Shows where the entrainment stimulus is being offered. |
| Dominant frequency | The strongest current usable peak. | Only interpret when signal quality is sufficient. |
| Band background | Delta, theta, alpha, beta and gamma. | Helps place the dominant peak in a recognizable brainwave band. |
2. Background brainwave bands
| Band | Approximate range | Practical interpretation |
|---|---|---|
| Delta | About 1-4 Hz | Very slow activity; may relate to deep rest, drowsiness, sleep pressure or low-frequency noise. |
| Theta | About 4-8 Hz | Imagery, hypnosis, meditative processing or relaxed internal attention. |
| Alpha | About 8-13 Hz | Relaxed alertness, eyes closed, calmer attention or recovery. |
| Beta | About 13-30 Hz | Active attention, thinking, task processing, tension or mental effort. |
| Gamma | About 30-40 Hz | Faster activity; often sensitive to muscle tension, noise and movement. |
Always include eyes open/closed, posture, session phase and sensor contact. An alpha peak with eyes closed can be normal. Strong continuous delta during active eyes-open work needs extra checking of signal and artifacts.
3. Power: higher is not automatically better
Power means the amount of energy shown in a frequency area. Higher power may indicate a stronger rhythm, but it may also come from artifacts, movement, blinking, jaw tension, electrode contact or technical noise. Read power together with signal quality and artifacts.
A useful spectrum graph is not necessarily a high graph. It is stable, explainable and appropriate to the session context.
4. Target frequency and entrainment match
The vertical target line shows the frequency offered by NeuroSync Pro through audio and/or light. In the screenshot, the target is 2.0 Hz. The dominant frequency is around 10 Hz, so entrainment match is low: the strongest measured peak does not coincide with the target.
That is not automatically bad. It means the current dominant EEG peak is elsewhere in the spectrum. With low targets such as 2 Hz, the brain may still show alpha activity, especially during relaxed eyes-closed rest. The session may also be in transition.
- High entrainment match: the dominant peak is close to the offered frequency.
- Low entrainment match: the dominant peak is elsewhere in the spectrum.
- Low match can be normal during start phases, transitions, eyes-open attention or natural alpha dominance.
- Use entrainment match as a trend over time, not as a final success score.
5. What does “Dominant 10 Hz” mean?
A label such as “Dominant 10 Hz” means the system currently detects the strongest usable peak around 10 Hz. 10 Hz usually falls in the alpha range and can fit relaxed alertness, eyes-closed rest, calm attention or a stable relaxation response.
Dominant does not mean exclusive. The brain produces multiple frequencies at once. The dominant frequency is simply the largest peak in the current analysis window.
6. Why the dominant band can be hidden
If signal quality is insufficient or unstable, NeuroSync Pro may hide the dominant band. This is intentional. Showing a dominant band with poor data quality can create false certainty.
| Situation | Why be careful? |
|---|---|
| Poor sensor contact | Peaks may be caused by contact loss. |
| Many artifacts | Movement or muscle tension can distort high or low frequencies. |
| Short measurement window | There may not be enough data yet. |
| Sudden isolated peak | A single spike may be a transient or measurement error. |
| Unexpected delta during active eyes-open tasks | Could be drowsiness, but also noise or low-frequency disturbance. |
7. Colors in the spectrum graph
Blue indicates lower power, green/yellow medium power and red/orange higher power peaks. The bright cyan line is the newest or most relevant current line. Softer background lines show earlier windows. Repetition matters: a peak that repeats across recent windows is more meaningful than a short flash.
8. Spectrum graph versus circle view
| View | Best for | When to use it |
|---|---|---|
| Circle view | Fast interpretation of state, stress, focus and sensor status. | During facilitation and practical decisions. |
| 3D Spectrum Waterfall | Frequency, power, target, dominant peak and trend analysis. | When looking more deeply at entrainment and frequency behavior. |
Use them together. If the circle view shows high artifacts, interpret spectrum peaks cautiously. If signal quality is good and the spectrum shows a stable peak, the interpretation becomes stronger.
Practical tips
- Let the graph build for several tens of seconds before drawing conclusions.
- Watch trends, not single peaks.
- Check signal quality and artifacts before interpreting dominant frequency.
- Compare dominant frequency with the session phase.
- Use entrainment match as an additional indicator, not as a success meter.
- Discuss the client’s subjective experience after the session; data without experience is incomplete.
Important limits
The 3D EEG Spectrum Waterfall is not a clinical EEG report and NeuroSync Pro is not a medical device. It is intended for observation, facilitation, reflection and professional session design. It cannot diagnose or rule out neurological or psychological conditions.
Do not use rhythmic light with photosensitive epilepsy, seizure history or unexplained loss of consciousness without medical clearance. Stop if headache, nausea, panic, agitation, derealization, dissociation, eye strain or other discomfort occurs.