The Muse Monitor circle view in NeuroSync Pro Audio+Light is designed as a quick visual interpretation window during sessions with Muse S Athena. It combines sensor contact, signal quality, calm, focus, artifacts, stress, heart rate, breathing, dominant frequency and entrainment match in one readable display. It helps professionals follow a session more clearly, but the values remain supportive indicators, not medical diagnostics.
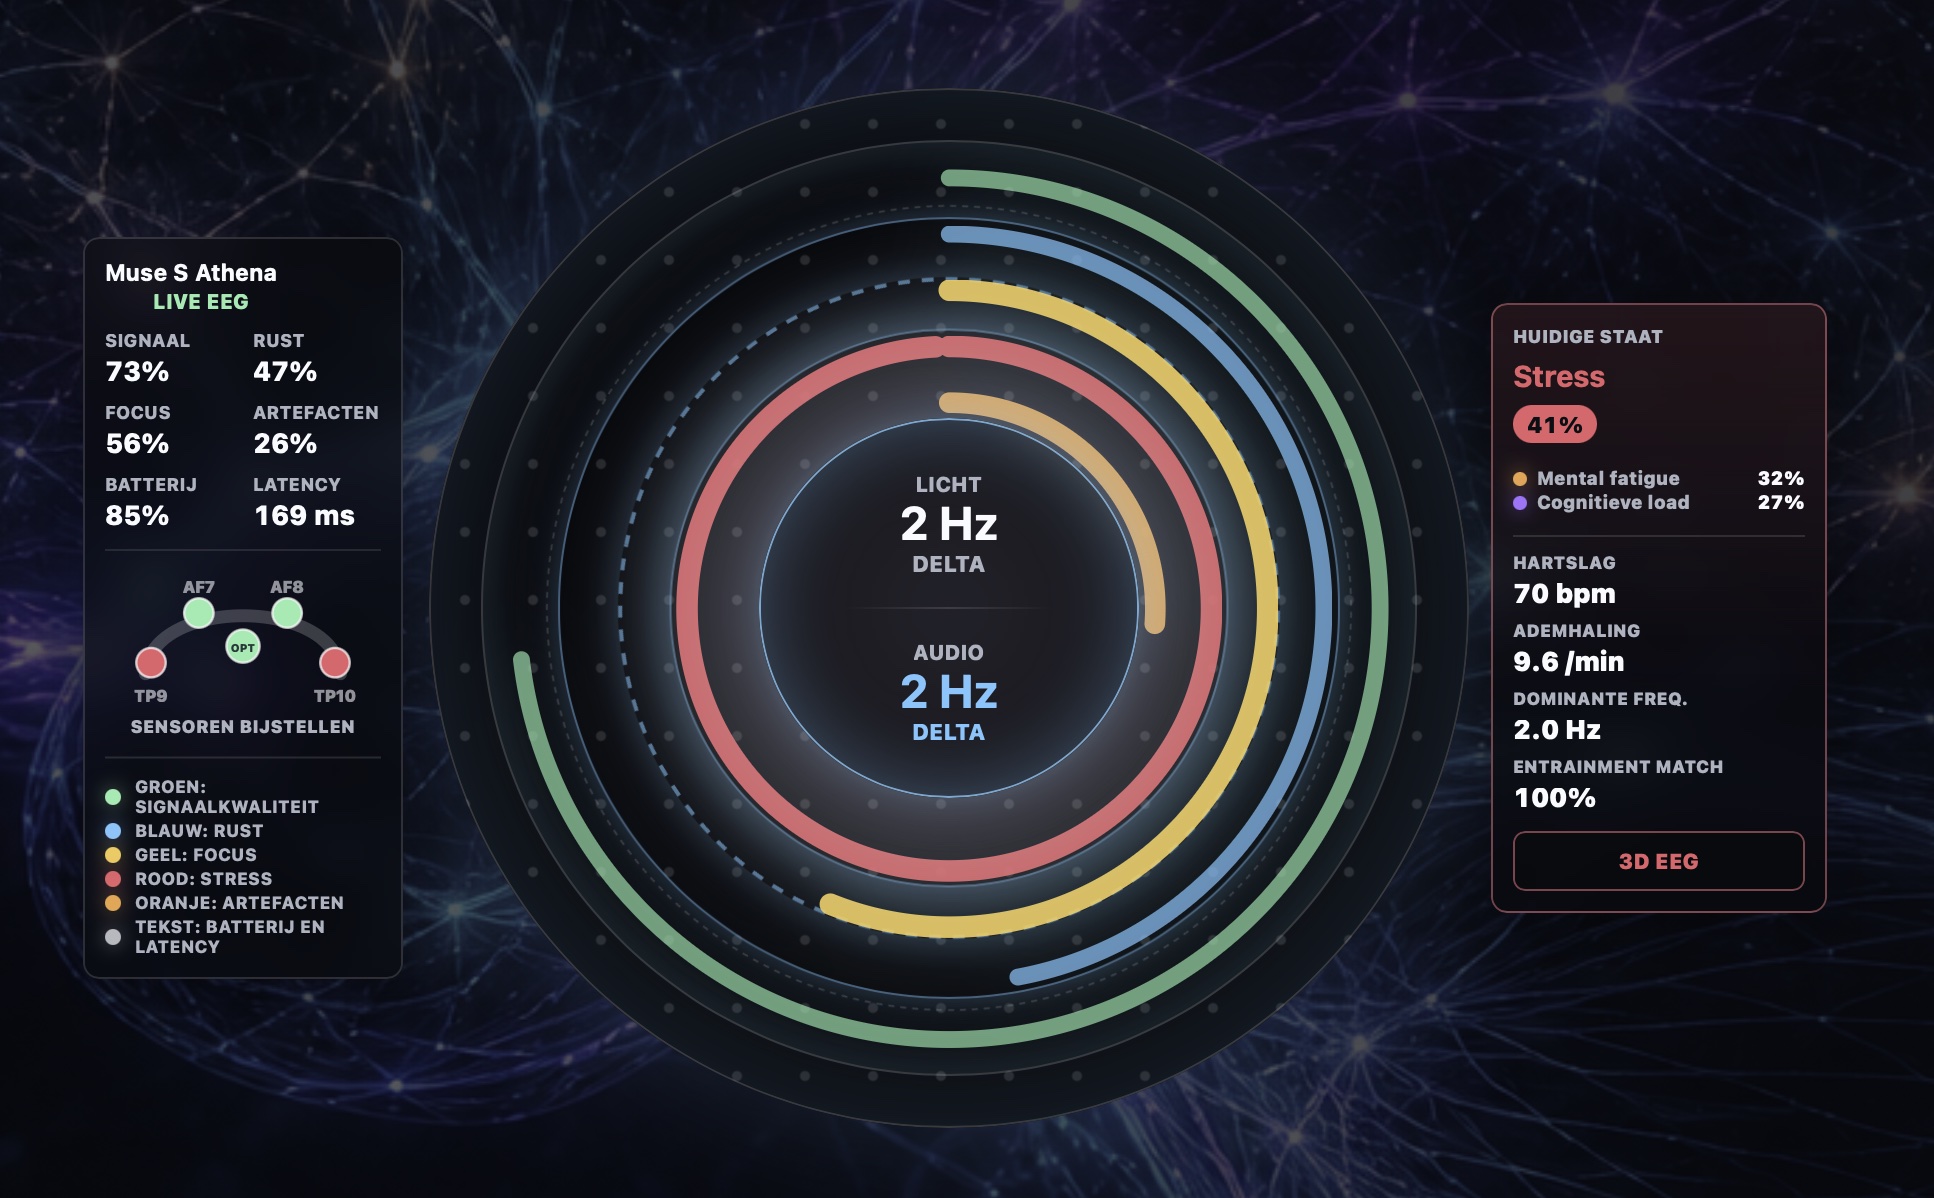
This guide explains how to read the circle view. Always interpret it on three levels at once: measurement quality, ring pattern and session context. A red stress ring means something different when sensor contact is weak than when all sensors are good and the user is moving through an intensive cognitive part of the session.
1. First question: is the measurement usable?
| Element | Meaning | Interpretation |
|---|---|---|
| Live EEG | The app is receiving current Muse data. | This is the basic condition for meaningful live interpretation. |
| Signal | A global estimate of measurement usability. | Preferably stable above about 65-70%. Lower values require caution. |
| Sensor dots | Contact status per sensor position. | Green is good; red or grey means placement or connection needs attention. |
| Battery | Muse S Athena charge level. | Low battery can cause dropouts or unstable data. |
| Latency | Delay between incoming data and display. | High or unstable latency says more about connection than about the client. |
If sensor status is insufficient, do not read the rest of the display too literally. Artifacts, stress, cognitive load and dominant frequency may be shaped by measurement noise.
2. The central rings: five signals in one image
| Color | Value | How to read it |
|---|---|---|
| Green | Signal quality | The more stable and reliable the data, the more useful the other indicators become. |
| Blue | Calm | An indication of relaxation, regulation or settled involvement. |
| Yellow | Focus | An indication of directed mental engagement or task involvement. |
| Red | Stress | A composite indication of activation, tension, restlessness, artifacts and reduced calm. |
| Orange | Artifacts | Movement, muscle tension, blinking, jaw tension, sensor disturbance or measurement noise. |
The circle view is not a pass/fail meter. It shows where the session appears to be leaning in that moment.
3. Why stress and calm can appear together
Some values can look contradictory. A client may lie quietly while the stress ring remains elevated. This may be caused by facial tension, micro-movement, breathing tension, frustration, sensor noise, cognitive processing or a session phase that temporarily increases activation.
Likewise, focus can be relatively high while the client feels relaxed. This may happen during imagery, hypnotic suggestion, breath focus or internal therapeutic work.
4. The right panel: current state and secondary values
The right panel summarizes the current pattern as a dominant state, such as Stress, Relaxation, Focus, Recovery, Cognitive load or Mental fatigue. Two secondary states are shown below it. Together they form an interpretation mix: the system usually sees several tendencies at once, but one state is most dominant.
| State | Plain-language meaning | When it may make sense |
|---|---|---|
| Stress | Increased activation, tension, measurement unrest or low regulation. | Tension, movement, many artifacts, high cognitive load or intense stimulation. |
| Mental fatigue | Reduced mental freshness or resilience. | A tired client, long sessions, low recovery response or heavy cognitive profile. |
| Cognitive load | Mental processing or effort. | Thinking, visualizing, inner work, programming, calculating, deciding or complex suggestions. |
| Relaxation | More calm, regulation or relaxed involvement. | Relaxation phases, eyes closed, calm breathing or recovery blocks. |
| Focus | Directed attention or task involvement. | Concentration, imagery, breath focus, hypnotic tasks or learning-oriented sessions. |
| Recovery | Regulation, restoration or decreasing load. | After a more intensive phase, during ending phases or recovery sessions. |
5. What a relaxed pattern may look like
| Value | Often compatible with relaxation | Nuance |
|---|---|---|
| Stress | Low to moderate, for example 10-35%. | A little stress may reflect noise, posture or residual activation. |
| Calm | Moderate to high, for example 60-90%. | Calm can fluctuate with breathing, thoughts and phase transitions. |
| Focus | Low to moderate, for example 25-65%. | In hypnosis or imagery, calm focus can be desirable. |
| Artifacts | Low, for example 0-20%. | Higher with movement, swallowing, jaw tension, blinking or sensor issues. |
| Cognitive load | Low to moderate. | Can rise temporarily during inner processing or suggestive tasks. |
| Mental fatigue | Low to moderate. | Can be higher when the client arrives already tired. |
A good relaxation profile is not “everything zero except calm.” A realistic profile is good signal quality, low artifacts, calm gradually rising, stress decreasing or staying low, and focus matching the type of session.
6. Dominant frequency and entrainment match
The right panel also shows dominant frequency. In the screenshot, it is 2.0 Hz, which belongs to delta. The central session setting also shows 2 Hz for light and audio, so the entrainment match reads 100%. This means the detected dominant frequency is close to the offered entrainment frequency.
Read this cautiously. Dominant frequency is meaningful only when signal quality is good and enough usable data are available. Continuous delta dominance during eyes-open activity may reflect relaxation or sleepiness, but also measurement noise, movement, sensor placement or algorithmic low-frequency dominance.
- A good match does not automatically prove that the session “worked.”
- A poor match does not automatically mean the session failed.
- Dominant frequency is more useful as a trend over time than as a single moment.
7. Heart rate and breathing
Heart rate and breathing provide context. A decreasing breathing rate may fit relaxation, especially when calm rises and artifacts remain low. Heart rate depends strongly on the individual, the session phase, expectation, caffeine, body temperature, emotion and movement. Trends are more useful than single values.
8. Common patterns
| Pattern | Possible meaning | Facilitator response |
|---|---|---|
| High stress + high artifacts | Movement, muscle tension or sensor noise may drive stress upward. | Check contact, jaw tension, posture and movement. |
| High stress + low artifacts + good signal | Possible real activation or mental/emotional load. | Lower intensity, choose a calmer phase or guide breathing. |
| High cognitive load + reasonable focus | The client is mentally active or processing a lot. | Can fit imagery, cognitive tasks or therapeutic work; monitor load. |
| High mental fatigue | The client may be mentally tired or less resilient. | Make the session softer, shorter or more recovery-oriented. |
| Calm rises + artifacts low | Relaxation or regulation is likely increasing. | Let the phase continue long enough. |
| Dominant delta remains continuous | May reflect relaxation/sleepiness, but also noise or low-frequency dominance. | Check signal, artifacts and eyes-open/eyes-closed context. |
9. During and after the session
During a session, use the circle view to support small facilitation decisions. Do not react to every second. Watch trends over 20 to 60 seconds. After the session, the full analysis is more important than the momentary display. It can connect phases, signal quality, state changes, heart rate, breathing and frequency following to the session structure.
Important limits
The Muse Monitor is not a clinical EEG system and NeuroSync Pro is not a medical device. The values are meant for observation, coaching, session design and reflection. They should not be used to diagnose or rule out conditions.
Do not use rhythmic light with photosensitive epilepsy, seizure history or unexplained loss of consciousness without medical clearance. Stop if headache, nausea, panic, agitation, derealization, dissociation, eye strain or other discomfort occurs. Never use sessions while driving, cycling or performing safety-critical activities.
Further reading
- NeuroSync Pro Therapeutic Audio+Light Edition for Muse S Athena integration, lightbar support and professional sessions.
- Knowledge & Insights for more articles on brainwave entrainment, frequencies and session design.
- Muse S Athena session analysis for the detailed post-session analysis workflow.
- Aurora Immersion™ mode for soft living colour fields in Audio+Light sessions.
- Infinity Ganzfeld™ mode for continuous full-field light.